Graph Design Platform
Turn complexity into
clear, visual models
For system thinkers
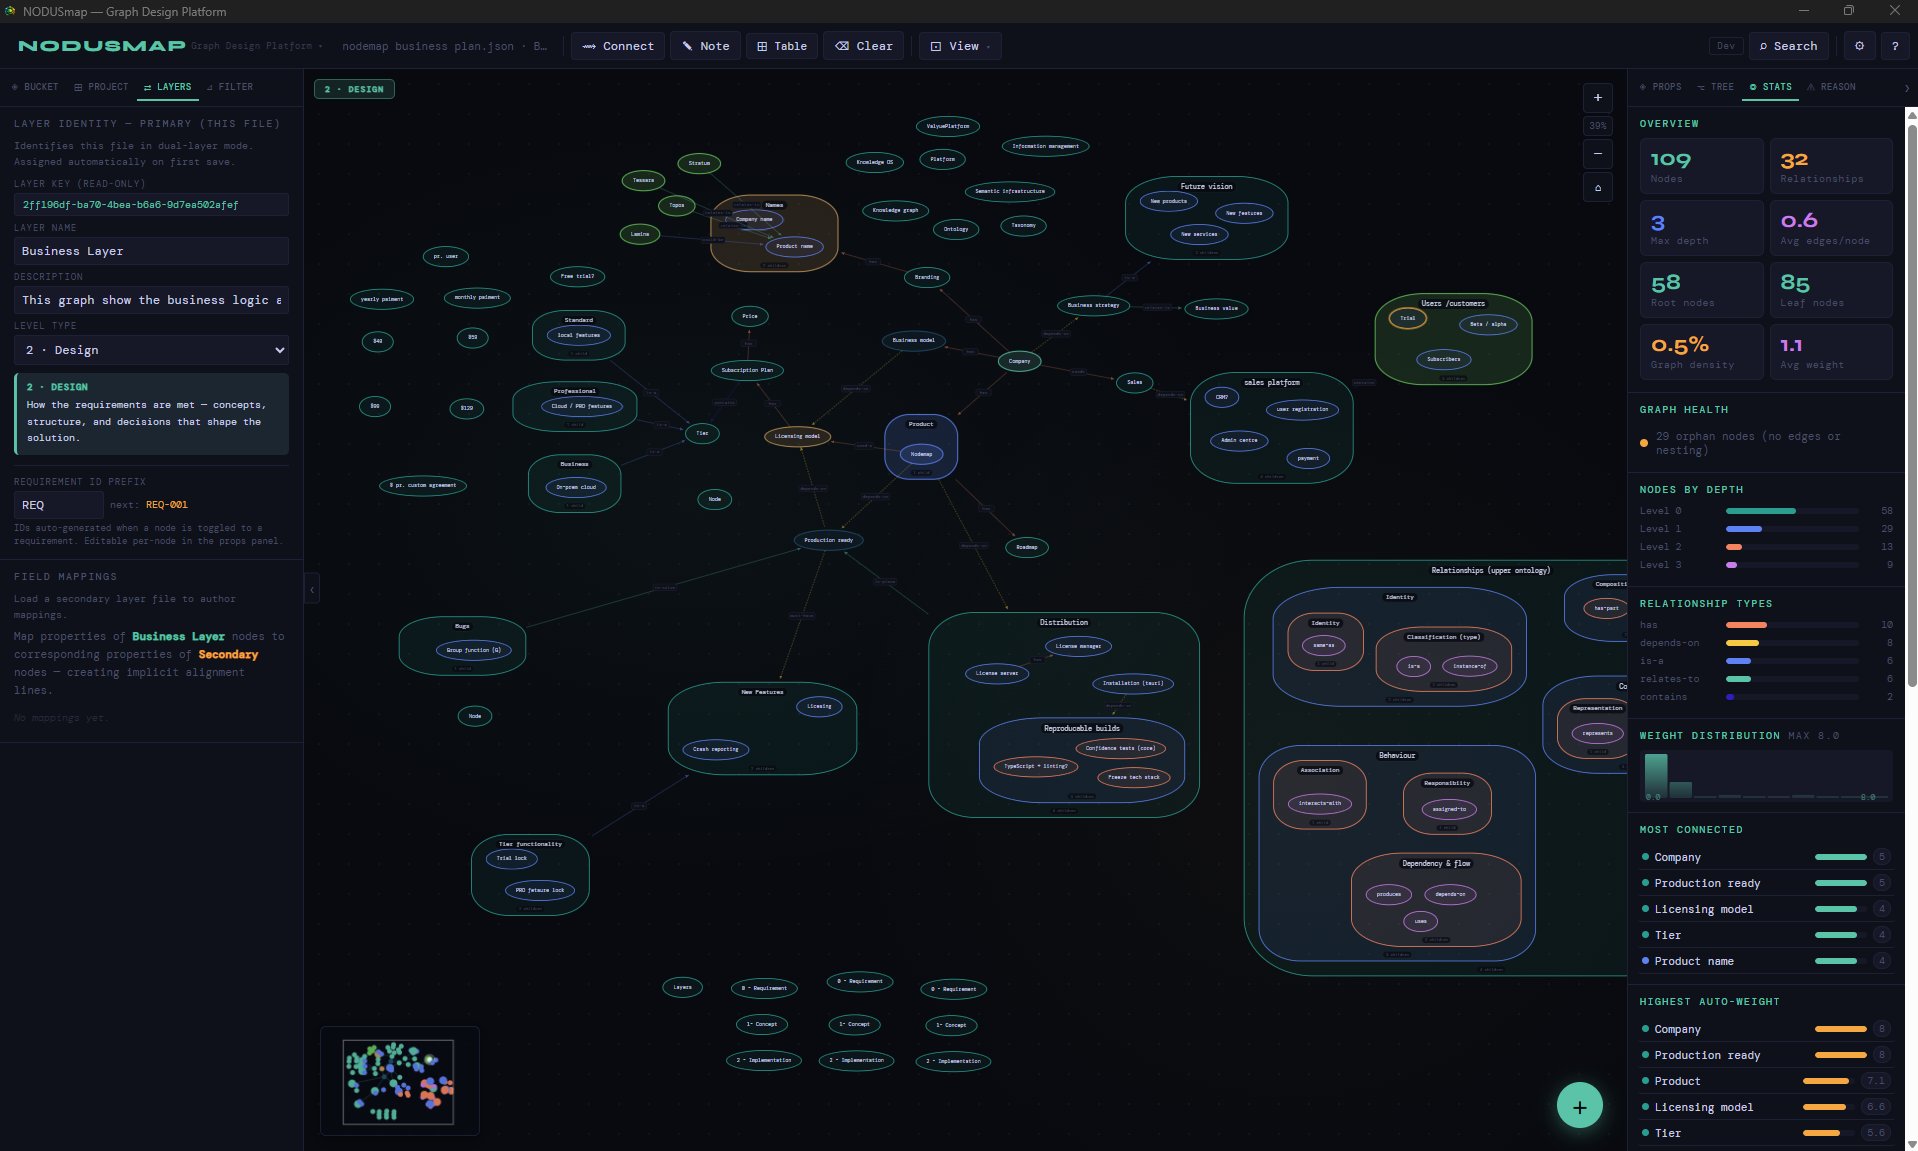
Model your domain knowledge visually — then make it AI-ready. Structured enough for accuracy, flexible enough for reality. Export directly into GraphRAG pipelines, knowledge graphs and ontologies.
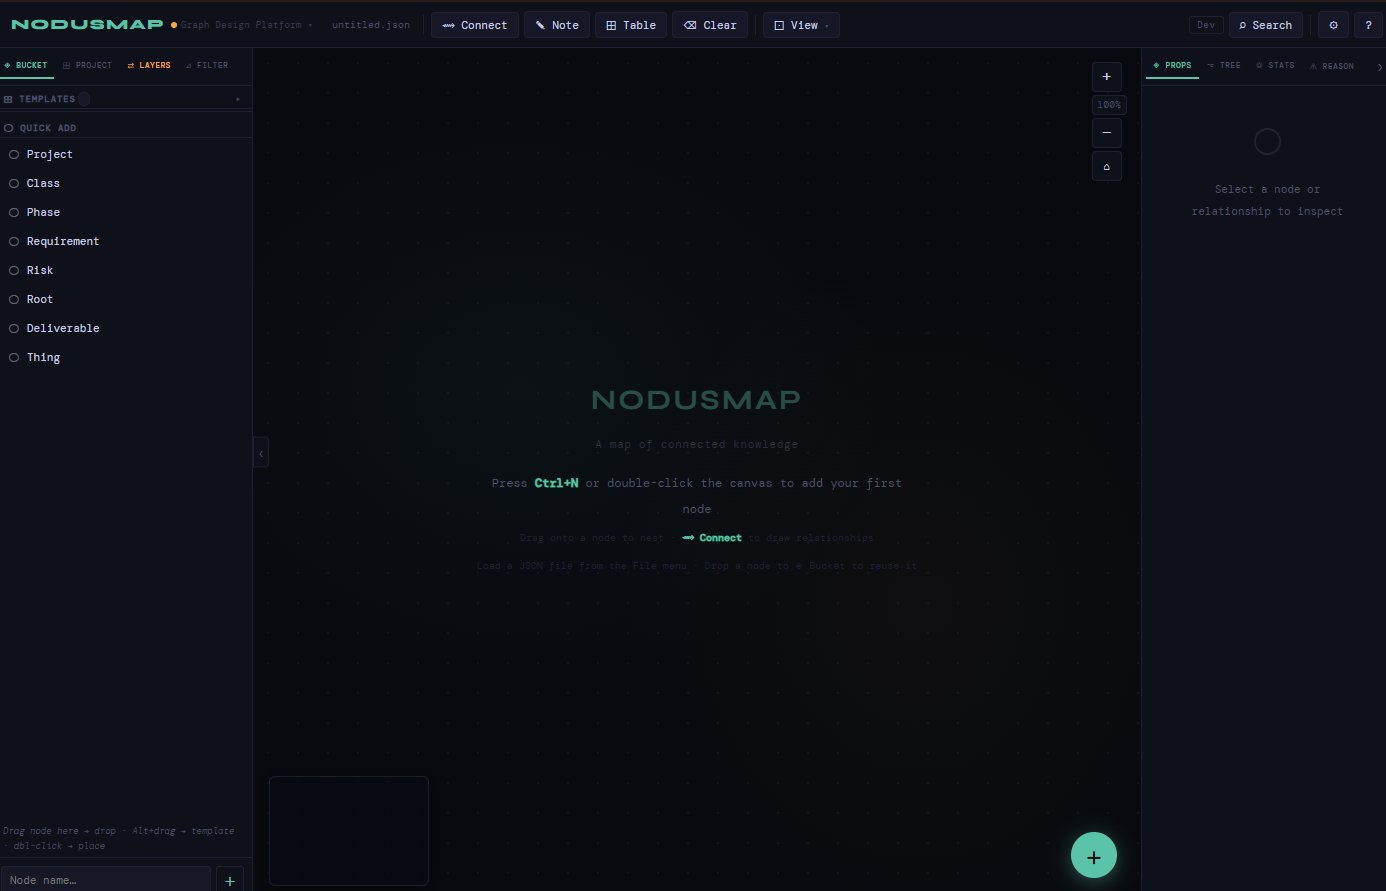
Visual graph canvas
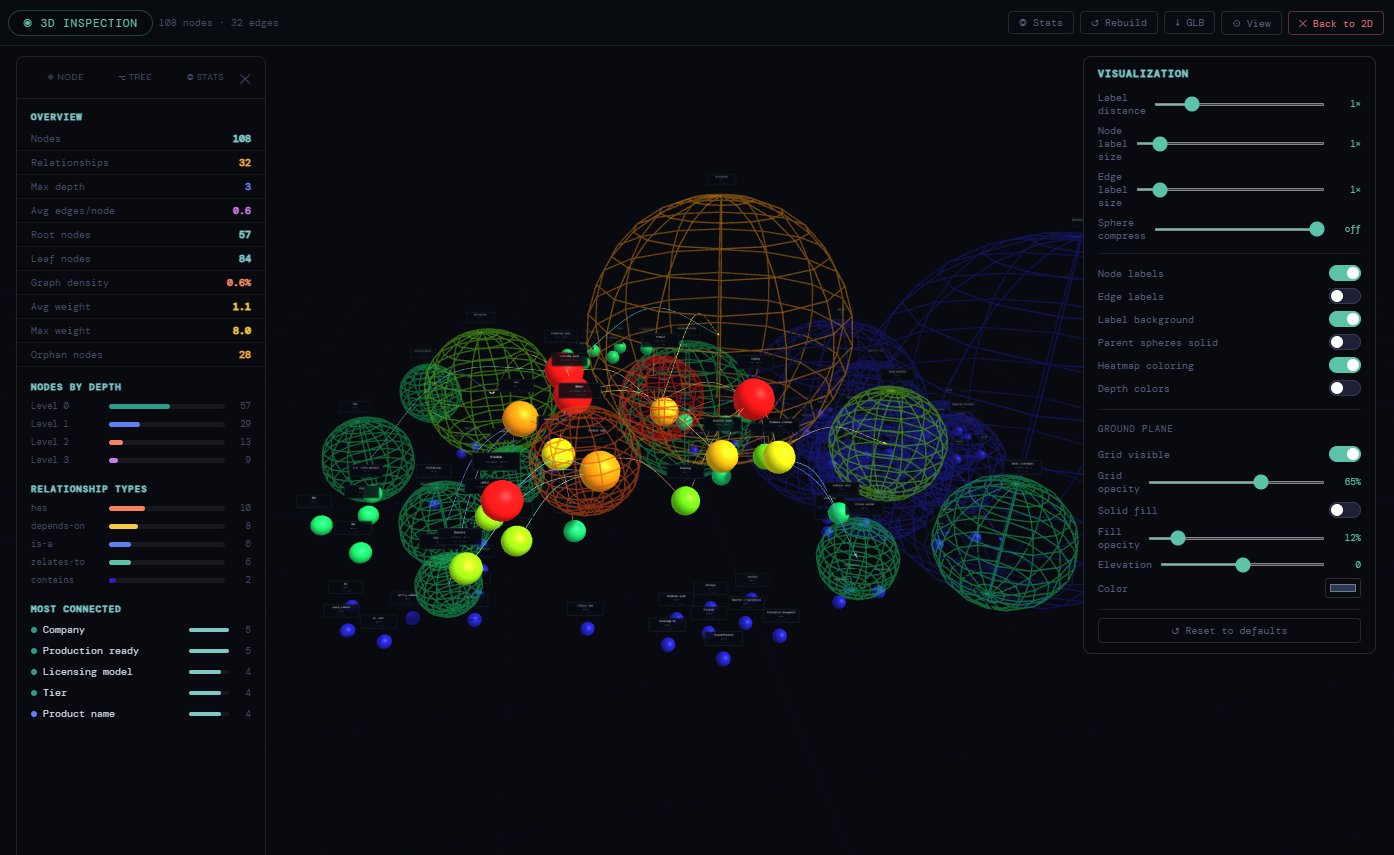
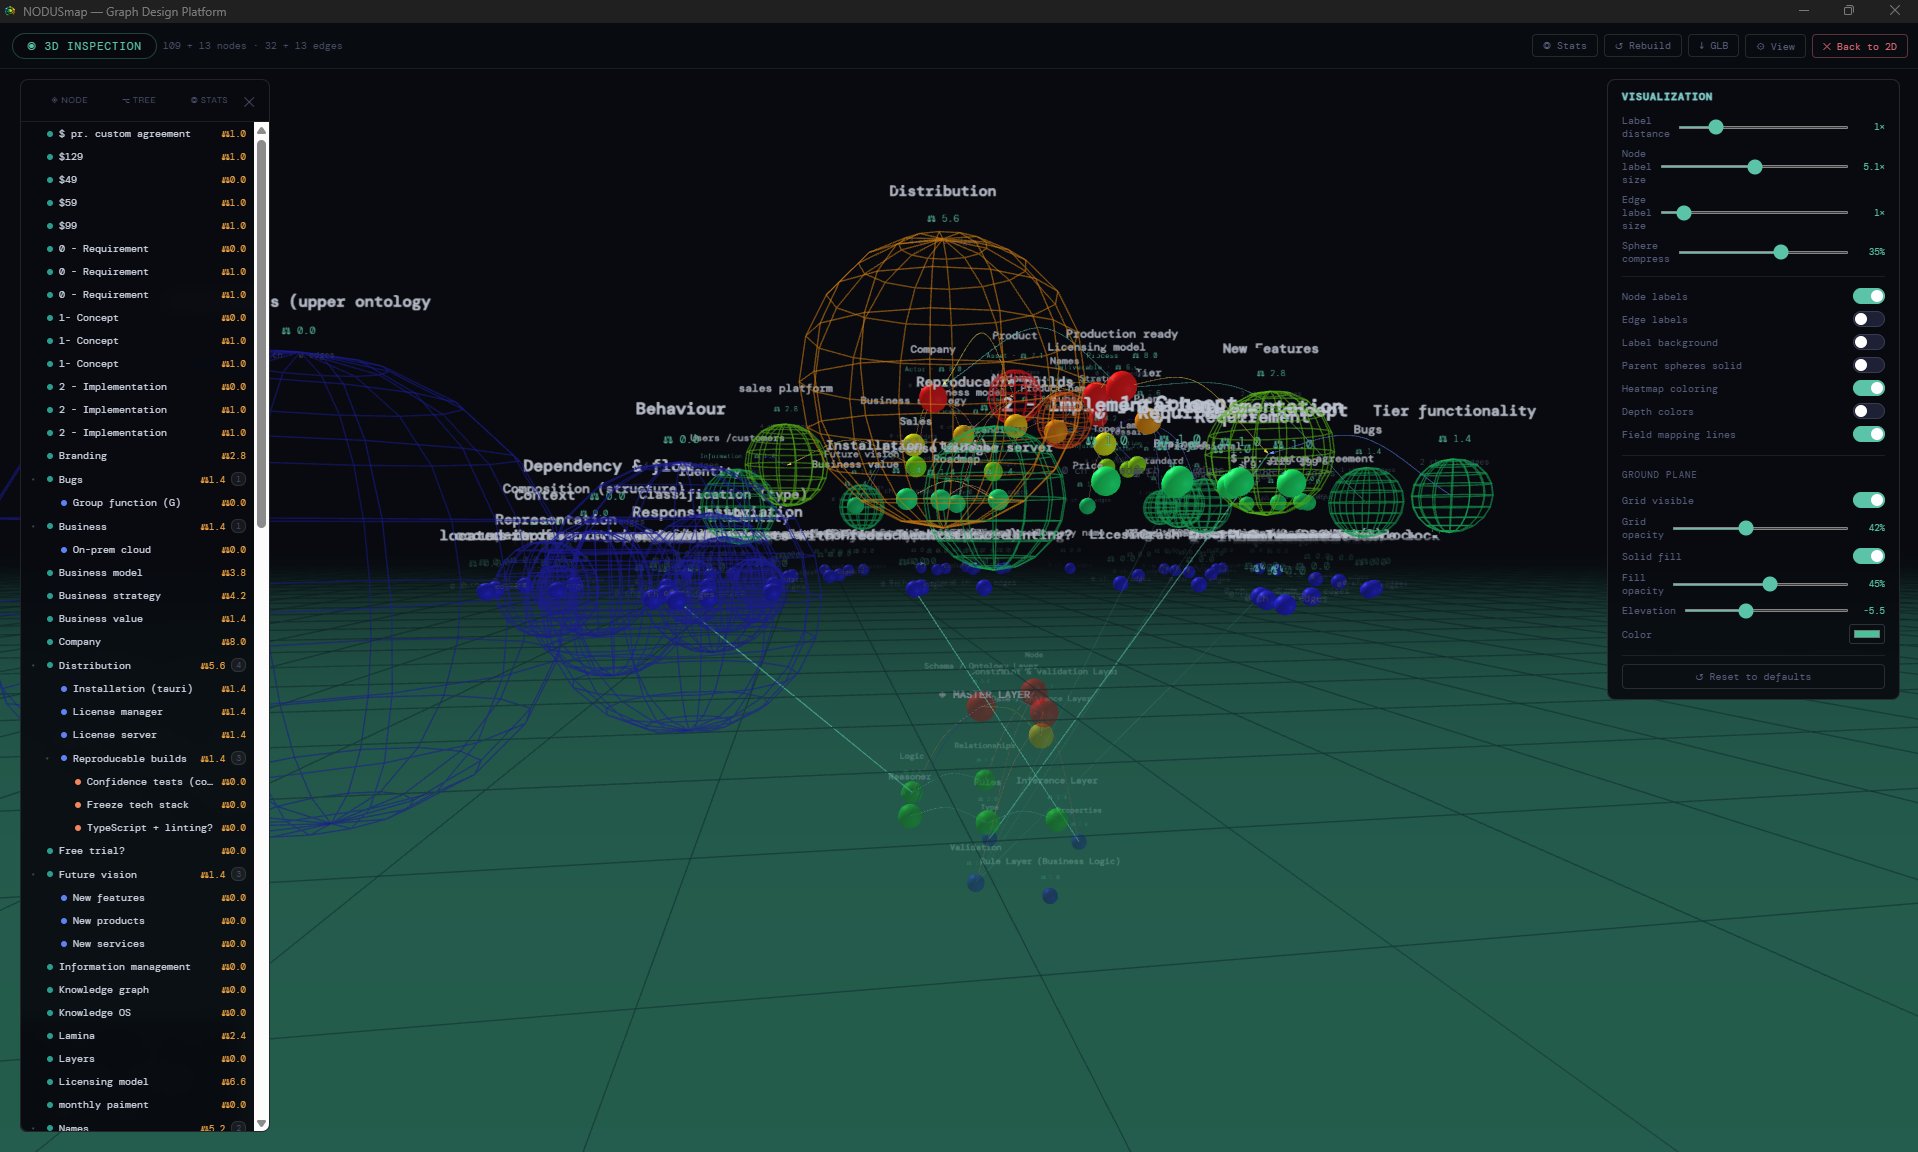
3D inspection
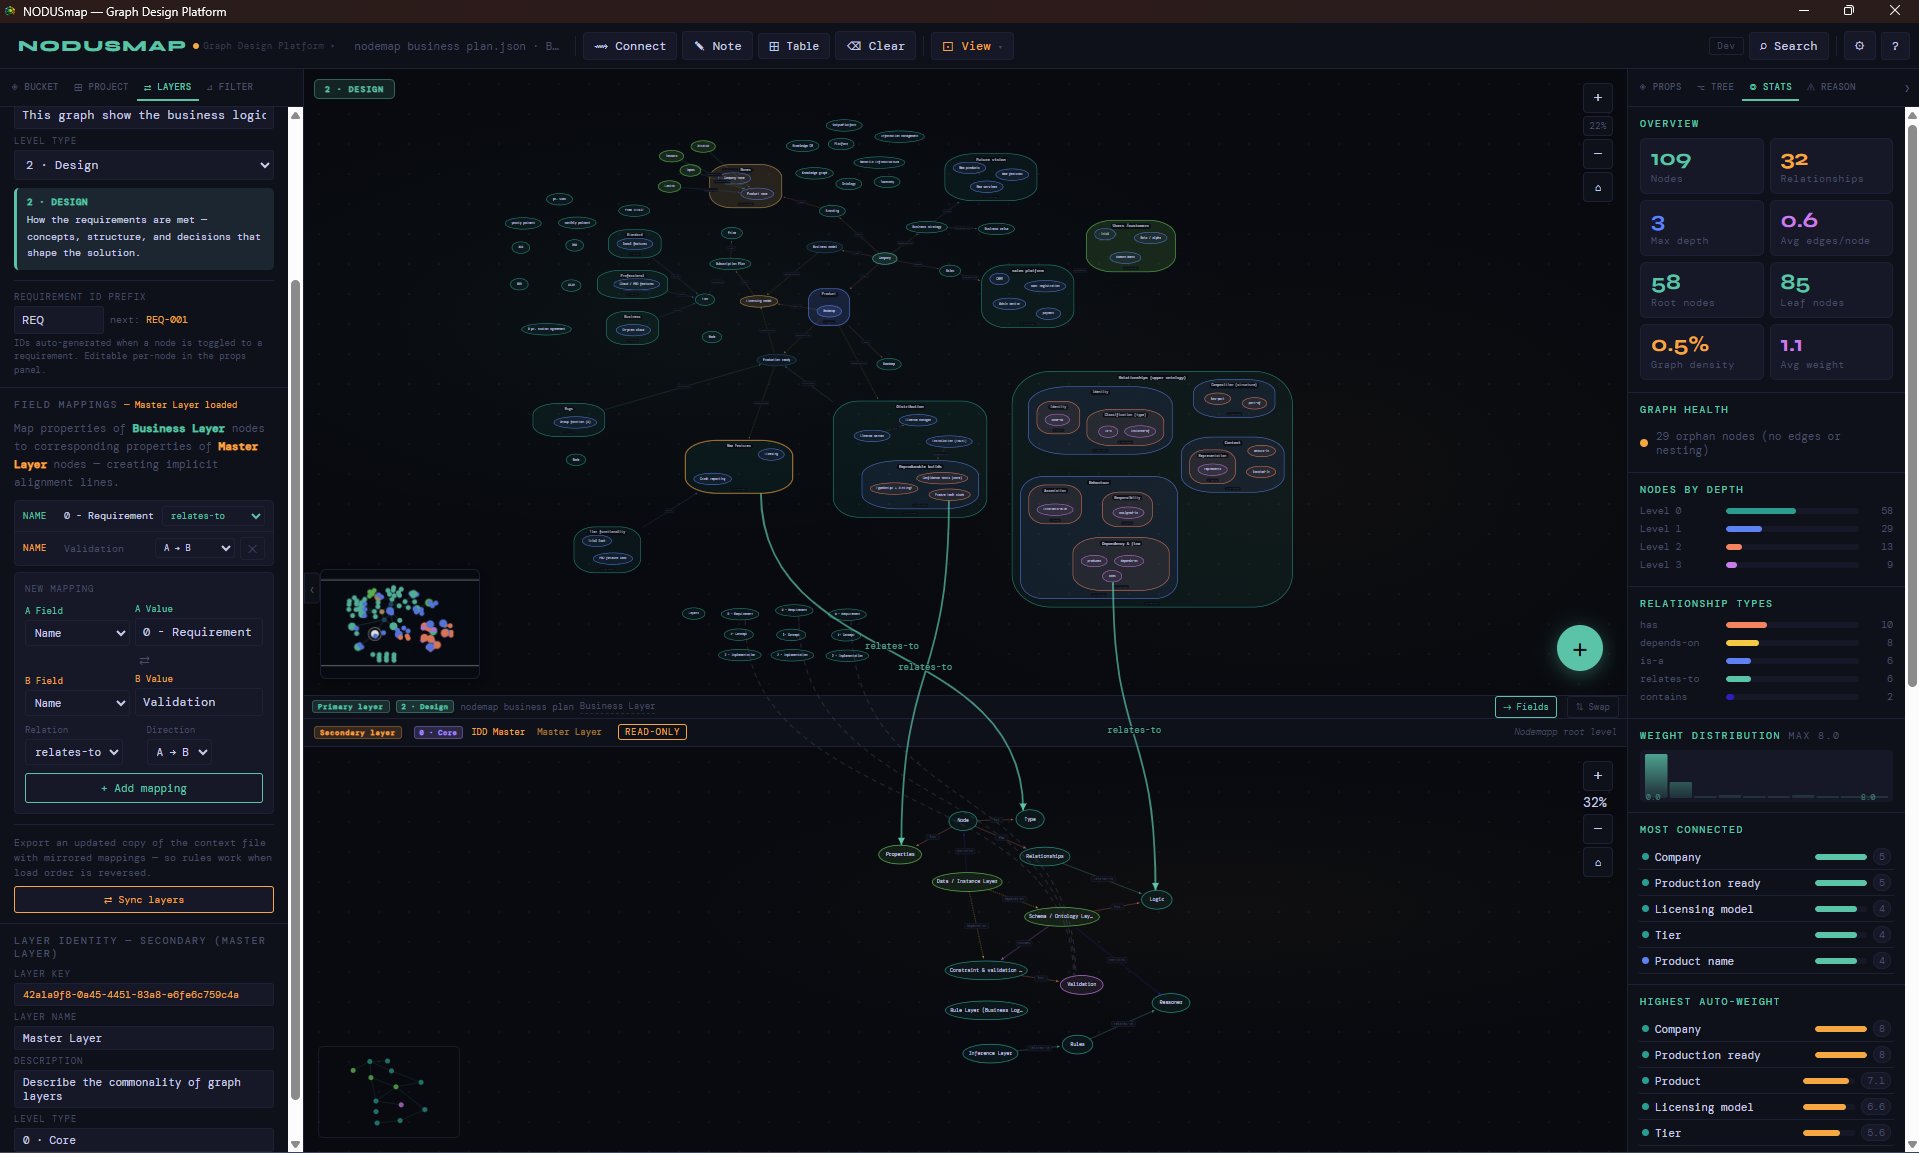
Dual-layer compare
GraphML · OWL · JSON · GLB
nodemap business plan.json — NODUSmap